By: Bill Pierson and Tim Miller
How to get total data connectivity
Building semiconductor chips is not a one-person job. Chip manufacturing today requires deep expertise across many disciplines and relies on decades of engineering work from hundreds of thousands of engineers and scientists. Up to 5,000 people can engage in taking a chip from design to high-volume production. No individual can be an expert across all chip manufacturing and design disciplines. Therefore engineers are going to develop the tools they need for their specific purposes. This has led to many, independently developed systems, operating on isolated data sets with minimal, if any, inter-connectivity. The consequence is multiple silos of data and actions whose combined value remains untapped.
One critical area in which that value remains untapped is production quality. Every decision and deviation that occurs from design to manufacture of a chip can impact whether the chip works or performs well. Furthermore, these different disciplines can also impact each other’s operation and functionality. Breaking down the barriers between disciplines is a constant struggle. The systems may continue in physical isolation but what can bring them together virtually is data. It can form not just the digital twin of each system, but the entire lifecycle, and by unlocking the latent value of the data the potential benefits are enormous.

One example is the relationship (or typically lack of relationship) between Front-end manufacturing and Back-end electrical test and assembly data. The expertise required to test a chip for electrical performance is very different from the knowledge required to successfully manufacture one. Over time the electrical test has evolved along a path with unique solutions and approaches separate from the manufacturing process that directly precedes it. As a result, not only is the subject matter different but so are the systems, formats, and data they produce.
As an example, electrical test data can identify chip performance failures, but cannot identify the cause or suggest the remediation. Consequently, even basic Statistical Process Control (SPC) is severely limited. It is only by correlating electrical test data back to the manufacturing data that insights can be gained into what deviations may have occurred, how they propagated and how they can be identified earlier. With the emergence of richer data analytics using machine learning, there are many more opportunities to determine root-cause as well as perform optimizations and control – all of which is the subject of another discussion.
Data volume challenges
Yet, the sheer volume of data makes this an impossible task to perform manually. As an illustration, when a probe card touches down on a wafer, it can perform thousands of operations in seconds. The result is 100,000’s of data points for a single wafer, across hundreds to thousands of wafers a day. Combine that with the thousands of sensors and context data on manufacturing equipment happening on a thousand processing steps and the resulting terabytes of data to sift through becomes a massive analysis challenge.
The sensor data volumes dwarf what incumbent systems can manage. One best practice approach is to work on a predetermined critical subset of the data that takes account of known connections between electrical measurements and manufacturing process steps. A simple example is evaluating gate transistor parameters at the e-test stage and using this to tune in the targets and limits for the gate module processing. These are the sorts of data challenges that other smart manufacturers are dealing with across other industry sectors.
According to VLSI Research and Applied Materials, there has been an explosion of sensor data for semiconductor manufacturing. Data points across deposition, etch, lithography, and defect/metrology has doubled to almost 4 trillion over the last few years increasing the necessity for a data management platform that can handle time-series data at these levels.
Choosing a fit-for-purpose data management system
There are 4 main criteria to consider for a data management system for manufacturing both for the front-end and the back-end. These criteria are: design for time-series data use cases, data ingestion performance, calculation/query performance, and cost.
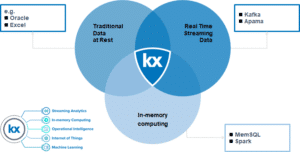
Design: Of critical importance is the ability to work with data in all its conditions: data at rest, real-time streaming, and in-memory computing. Today many IT departments need to piece together various vendors to put together data condition use cases that deliver richer analytics and provide solutions. KX is the only technology designed to work in all 3 domains: data at rest, real-time streaming, and in-memory computing.
Kdb+ is a column-oriented database that is fully relational. This includes an integrated in-memory and on-disk database, with low latency, and deployment options from integrated solutions, to on-premise, cloud or edge. The inclusion of an array-oriented programming language allows you to perform analytics as the data arrives and manage data more efficiently.
Ingestion: Running on a single server kdb+ can:
- Ingest and store 30 million sensor readings/second and over 10 TB per day
- Aggregate over 40 billion sensor readings in under 2 minutes
- Retrieve over 100 million sensor readings per second
- Search in-memory tables at 4 billion records/second
- Deliver sub-millisecond latency for streaming event processing
At the APC Conference, San Antonio,2019, Chris Reeves detailed the data rates for a typical ATP (Acceptance, Test and Packaging) Back-end manufacturing fab and highlighted the volume of test data is on order of 0.5GB/sec, aggregating up to 4Petabytes of data in 90 days. This includes tool data from backgrind, wafersaw, dieattach and especially the wirebond tools. To understand more on how we architectured kdb+ for fast data ingestion, check out our blog “What makes time-series database kdb+ so fast?” Kdb+ uses the KX for Sensors framework for enterprise management and to efficiently manage data for ingestion, computing, retrieval, and storage.
Computing/Query: Our programming language, q, natively supports array operations and parallel computations, exploits vector instructions from Intel CPUs, and automatically distributes database operations across CPU cores. KX technology allows the fast performance of calculations and queries as the vector approach allows you to execute many more simultaneous operations within a single operation of the CPU, reducing the number of operations required to get results. As users start to use the large datasets from front-end manufacturing combined with the back-end test this level of analytic performance will become even more important.
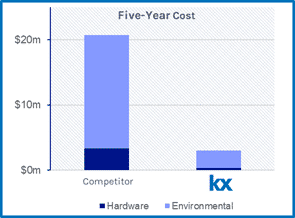
Cost: In the same APC presentation, the authors highlighted their metric requirements was speed to data and total cost of ownership for their reasons for utilizing kdb+. Applied Materials decided to use KX technology as a crucial component of its multi-step strategy in getting to all the data and managing this data at a lower cost of ownership. They are working to bring the Back-end ATP processes in line with the frontend 200 and 300mm facilities. In a separate analysis done by KX, we demonstrated environmental costs savings of 90% and a hardware (including maintenance and support) of 85% based on the following assumptions over 5 years:
• 150 million sensor readings/sec ingestion
• 77 TB/day storage (compressed 15TB/day)
• Concurrent 1,250 queries/sec
• 6 months of data retention (2.7PB)
Money to burn?
Without connecting electrical test data to manufacturing data in the correct way, companies leave millions and millions of dollars on the table. As Tim has said in a previous post, “Think about not having to wait for your data anymore. If you’ve ever been frustrated by slow data and slow yield learning, if you want to save your company millions in waste, if you want to make the quality of life better for your teams, all it takes is getting the right people in place and making the decision to make the change.”
Bill Pierson is VP of Semiconductors and Manufacturing at KX, leading the growth of this vertical. He has extensive experience in the semiconductor industry including previous experience at Samsung, ASML and KLA. Bill specializes in applications, analytics, and control. He lives in Austin, Texas, and when not at work can be found on the rock climbing cliffs or at his son’s soccer matches.
Tim Miller is Chief Executive of Navigation AMCC Inc., taking his years of experience in semiconductor Advanced Process Control at leading-edge fabs and major suppliers, and moving into advanced manufacturing fields across the globe. When not traveling, he is enjoying the good life with his family in Apex, NC, voted the best place to live in America (Money, 2015).
![]()


