By Matthew Maynes
KX has a broad list of products and solutions built on the time-series database platform kdb+ that capitalize on its high-performance capabilities when analyzing very large datasets.
KX Analyst is a powerful graphic user interface combined with an integrated analytics package which puts the power of kdb+ in the hands of business users so they can take advantage of its speed, without needing to learn the underlying language, while also enhancing the capabilities of the developer and data scientist by providing an IDE rich in productivity features.
In this series, we take a look at what makes KX Analyst such a powerful tool for sophisticated domain users. The first article in the series takes a close look at modern data extraction and preparation, showing the first step – extracting and transforming external datasets. With the underlying kdb+ engine this process is simpler and more direct than with traditional approaches.
Introduction
Data extraction and preparation is a cornerstone of any data science project. In order to do meaningful analysis of a dataset, the data must be prepared such that its quality and information can be trusted. If the data has invalid or corrupt information, then any conclusions drawn from it could be false.
ETL is the process of extracting, transforming and loading data for various sources and formats into a high quality, refined version that can be used to answer meaningful questions and extract value from the data. Traditionally, ETL is done across a multi-server platform with one machine processing the data and shipping it to a data warehouse for storage. With more modern architectures, larger volumes of data can be processed in place eliminating the need for additional systems. By leveraging the columnar, vector nature of kdb+, Analyst takes a much more modern approach to ETL by being able to process and analyze massive amounts of data on a single system.
KX Analyst is a general purpose, end-to-end data exploration platform powered by kdb+. As an end-to-end exploration platform, Analyst’s graphical tools, such as the data importer and transformer, facilitate creating ETL pipelines while handling the common issues and minutiae of data ingest and transformation. This post examines these tools and how they can be used to prepare a collection of data sources.
Extracting Data Sources
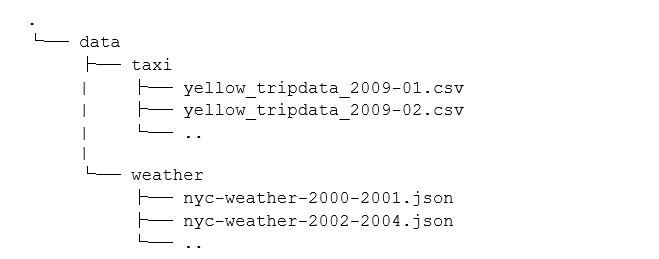
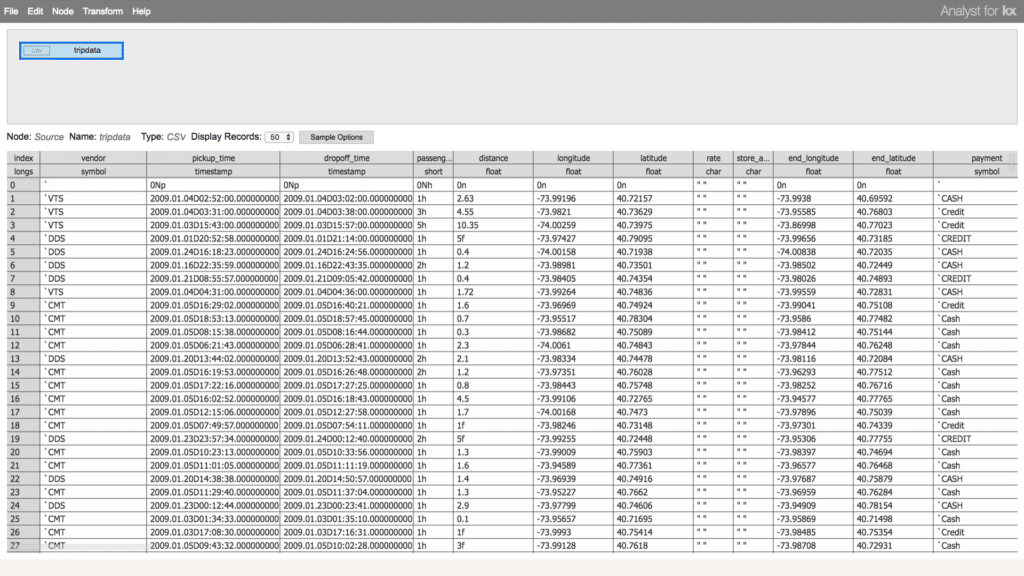
We will demonstrate these tools by way of example. We have taxi and weather data for New York City split into several CSV and JSON files that need to be imported. The data from these sources needs to be ingested into table format in kdb+ with a schema that is suitable for the content of each column. First, let’s examine the files we need to ingest. Our data project contains the following files:
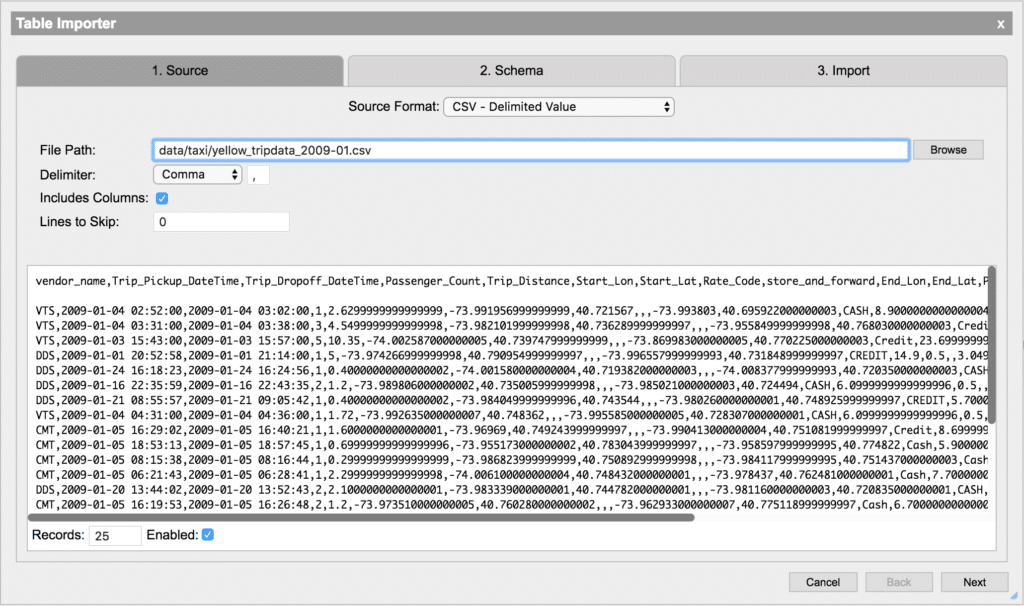
Rather than requiring scripting knowledge to import the data, Kx Analyst enables both business users and developers to rapidly import data via the Table Importer. The graphical view provides a preview of the file’s content without worrying about the raw file size. This is very useful for identifying the headers and other metadata commonly accompanying data that should be ignored during processing.
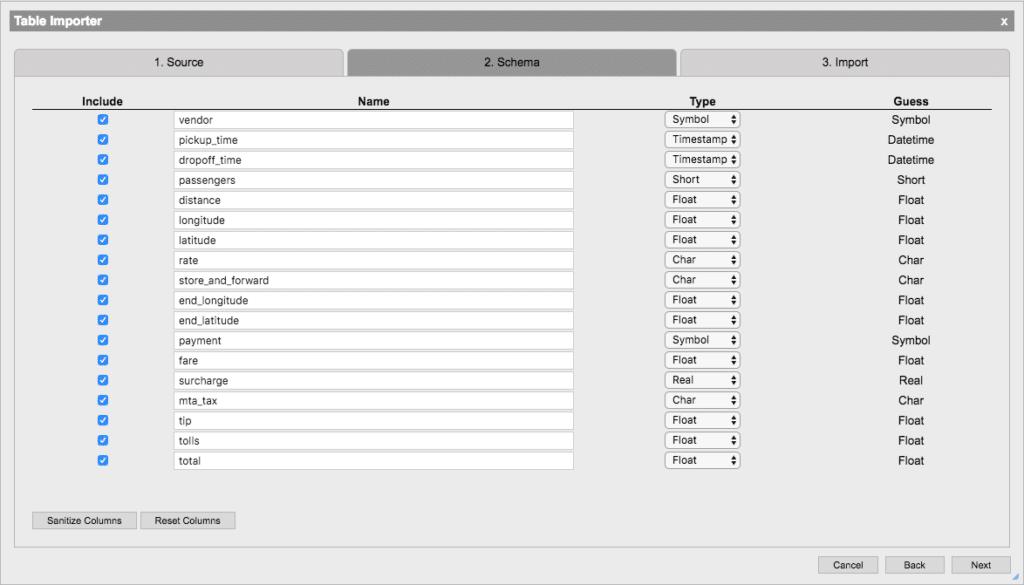
With this high-level understanding of the data we want to import, we need to define a schema to represent that data. The data schema allows us to map column names to data types which will give meaning to our data. Creating a schema is normally a manual process of defining some basic metadata such as column name and type. The Table Importer will automatically identify the types of the columns using a sample of the data provided. If any of the column names or data types that the importer selected are incorrect, they can easily be changed in the schema view. If it has a more complex data structure, such as those commonly found in JSON data and other document storage formats, we can use Analyst’s Table Transformer to perform further processing after import.
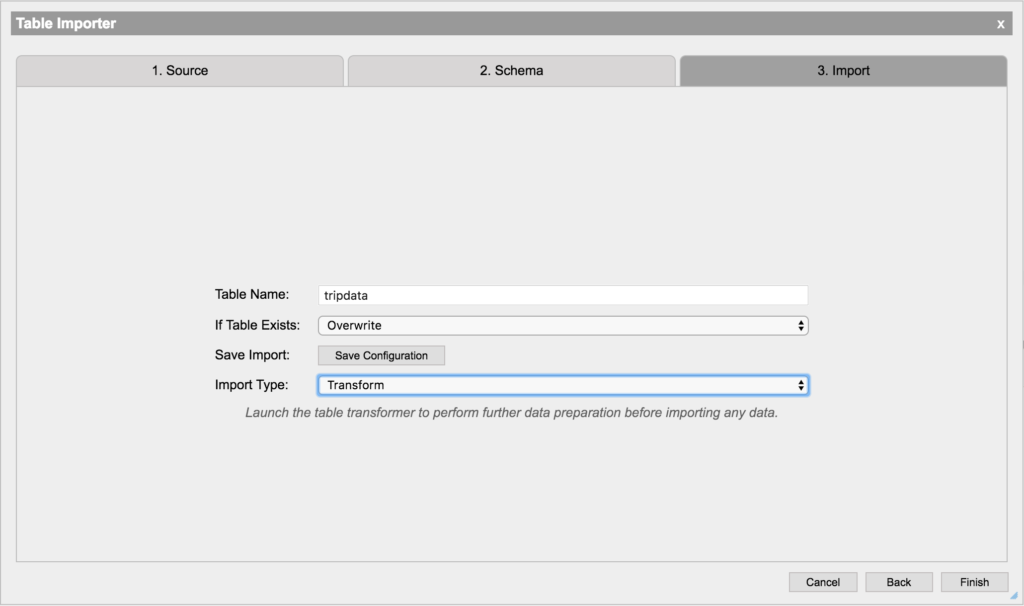
Finally, we will configure the importing of the data. This will perform the extraction step of the ETL pipeline. In order to perform some further enrichment on this data, we will select the Transform option and press Finish. From here we could begin to analyze the data, however it is almost always necessary to perform transformations to the data in order to prepare it for query. We continue directly from the Importer to the Transformer in Analyst.
Transforming the Data
Data transformation allows source data to be refined, reshaped, filtered and enriched. It is important to see how each operation in the transformation workflow will affect the output. Traditionally, this is done by creating single select and update commands and executing them on a portion of the data and inspecting the result. This manual process can create a large feedback loop and requires a significant amount of trial and error to create a complete transformation process. Even more dangerous is experimentally performing these transformations on the data as a whole. If these transformations are done in-place, we run the risk of corrupting the data if the transformation author made false assumptions about the data.
To reduce complexity and risk, KX Analyst provides a Table Transformer, a user interface for rapidly prototyping a transformation workflow using data samples. The Table Transformer provides a point and click interface for common transformation operations and offers a highly extensible framework for including user defined code. Once a transformation workflow has been completed, it can be saved and compiled into a kdb+ function that can be used independently of the Transformer and even externally in a non-Analyst runtime.
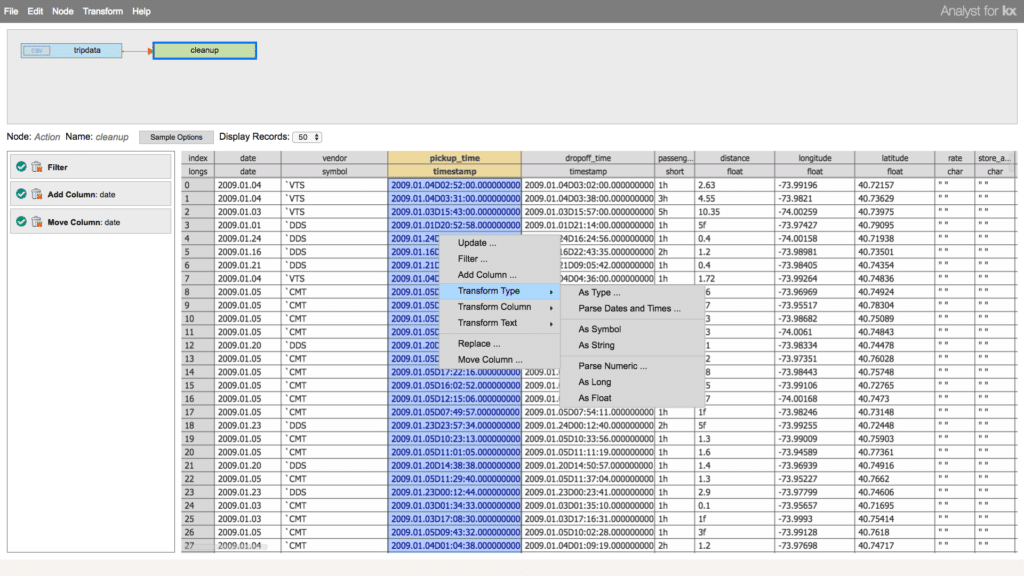
Continuing with the example data and extraction using the Table Importer, we have opened the Table Transformer. A node for the tripdata table is now the first table in our workflow. The top pane of this window will be the workflow we are creating visually depicts the ETL pipeline. The table pane below it shows a sample of the data that we are transforming. It is important to be able to see the data you are working on and how your transformation changes that data.
To groom the data, we will add an Action Node that will allow us to perform operations which will clean up and prepare the data. We can leverage this node in the workflow to perform filters and updates on our table. Here we will filter out any null or invalid data, add some additional columns and rearrange the table.
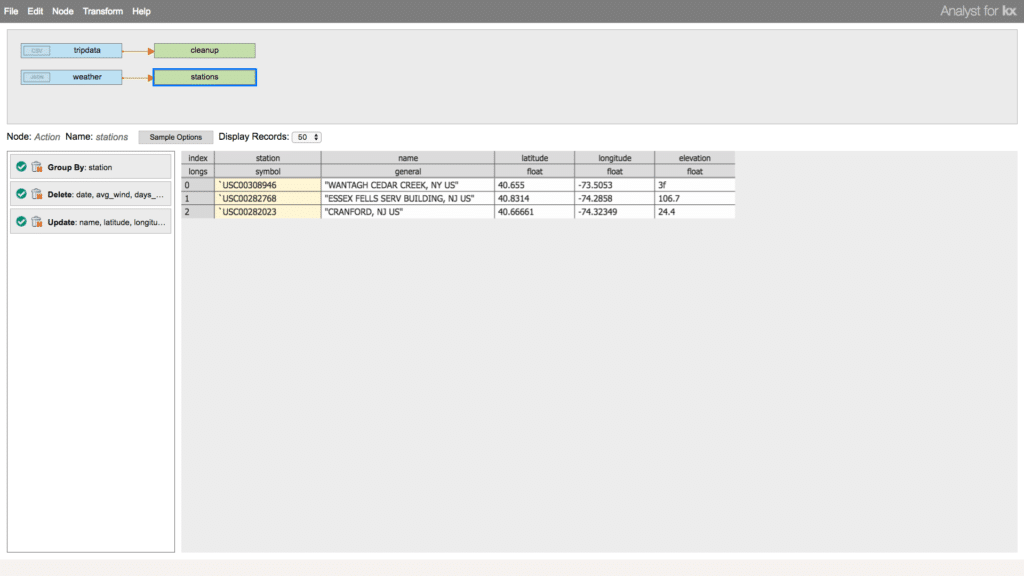
To truly leverage all the data we have available and draw insights from multiple dimensions, modern ETL pipelines require the ability to join and link multiple disparate data sources together. Now let’s enrich the data. Here we will add another table data source to the workflow pipeline that we can join to the first to add supplementary information. For this task, we will import a data set containing the weather conditions in New York City for the time window of taxi rides we are analyzing. We can add an Action Node for this table as well to refine its information.
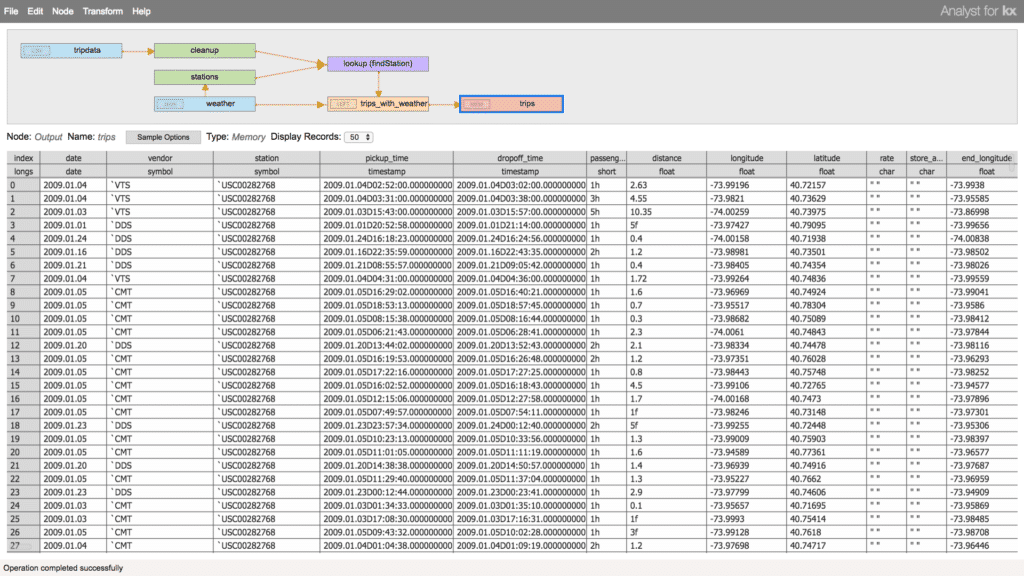
Finally, we can join these data sets together and specify an output data source as the result of the ingest, transformation, enrichment, and export them to a table. Exporting the data allows us to capture the final product of the transformation and use it outside of the transformer.
Loading the Data
Now that we have created a complete workflow to extract and transform our data to the desired shape and schema, we will want to actually load the data for analysis. All of the work done in the Transformer is a staging area. The data has not yet been ingested or computed. To perform the ingest, we can either run the transformation directly from the user interface by selecting Transform > Run or we can compile the transformation into a kdb+ function and execute it later as part of a script, scheduled job, etc. When we save the transformation, we produce an executable form of the ETL workflow which can be used on demand with the same, or different data sources.
Next Steps
Now with the data groomed and imported, we are ready to do some further analysis. KX Analyst comes with a suite of visualization and analytic tooling for exploring the data. In a future post, we will explore using these tools, the problems they solve, and the power of kdb+ to take a deeper dive into the data.
Data Acknowledgments
The data used in these examples is open source and publicly available from the following sources.
- TLC Trip Record Set: http://www.nyc.gov/html/tlc/html/about/trip_record_data.shtml
- NYC Weather: https://www.ncdc.noaa.gov/cdo-web/datasets/GHCND/locations/CITY:US360019/detail
To learn more about KX Analyst, please read the Product Overview, and find future articles in this series, and more ‘Featured News and Highlights’ about KX Analyst.


