By Nickolas Stathas
Nick Stathas was a software lead for a university motorsports team whose race car competed in the international Formula SAE competition in June 2018. Nick built an open-source code base of embedded components for monitoring the car’s systems’ including the vehicle control unit and battery management system, as well as a cloud-based data processing pipeline. As part of the project he adapted the telemetry system of the car to interface with KX Dashboards, giving the team the ability to perform real-time analytics of the car’s performance while in motion.
Introduction
The Formula SAE competition tasks students to design, build, and engineer a vehicle that fulfills the requirements of a potential customer—an amateur driving enthusiast. Starting from the ground and building up, each team is judged on the cost, business case, and design itself before hitting the track for a variety of dynamic driving events.
Formula SAE pushes students to apply what they have learned in the classroom to a real-world project. Having the opportunity to oversee and complete the design of both specific parts and the overall systems provides team members an unparalleled experience of seeing a high-level project to completion. With applications ranging from the automotive, aerospace, consumer electronics, and data acquisition, students can prepare themselves to engineer where they are needed most.
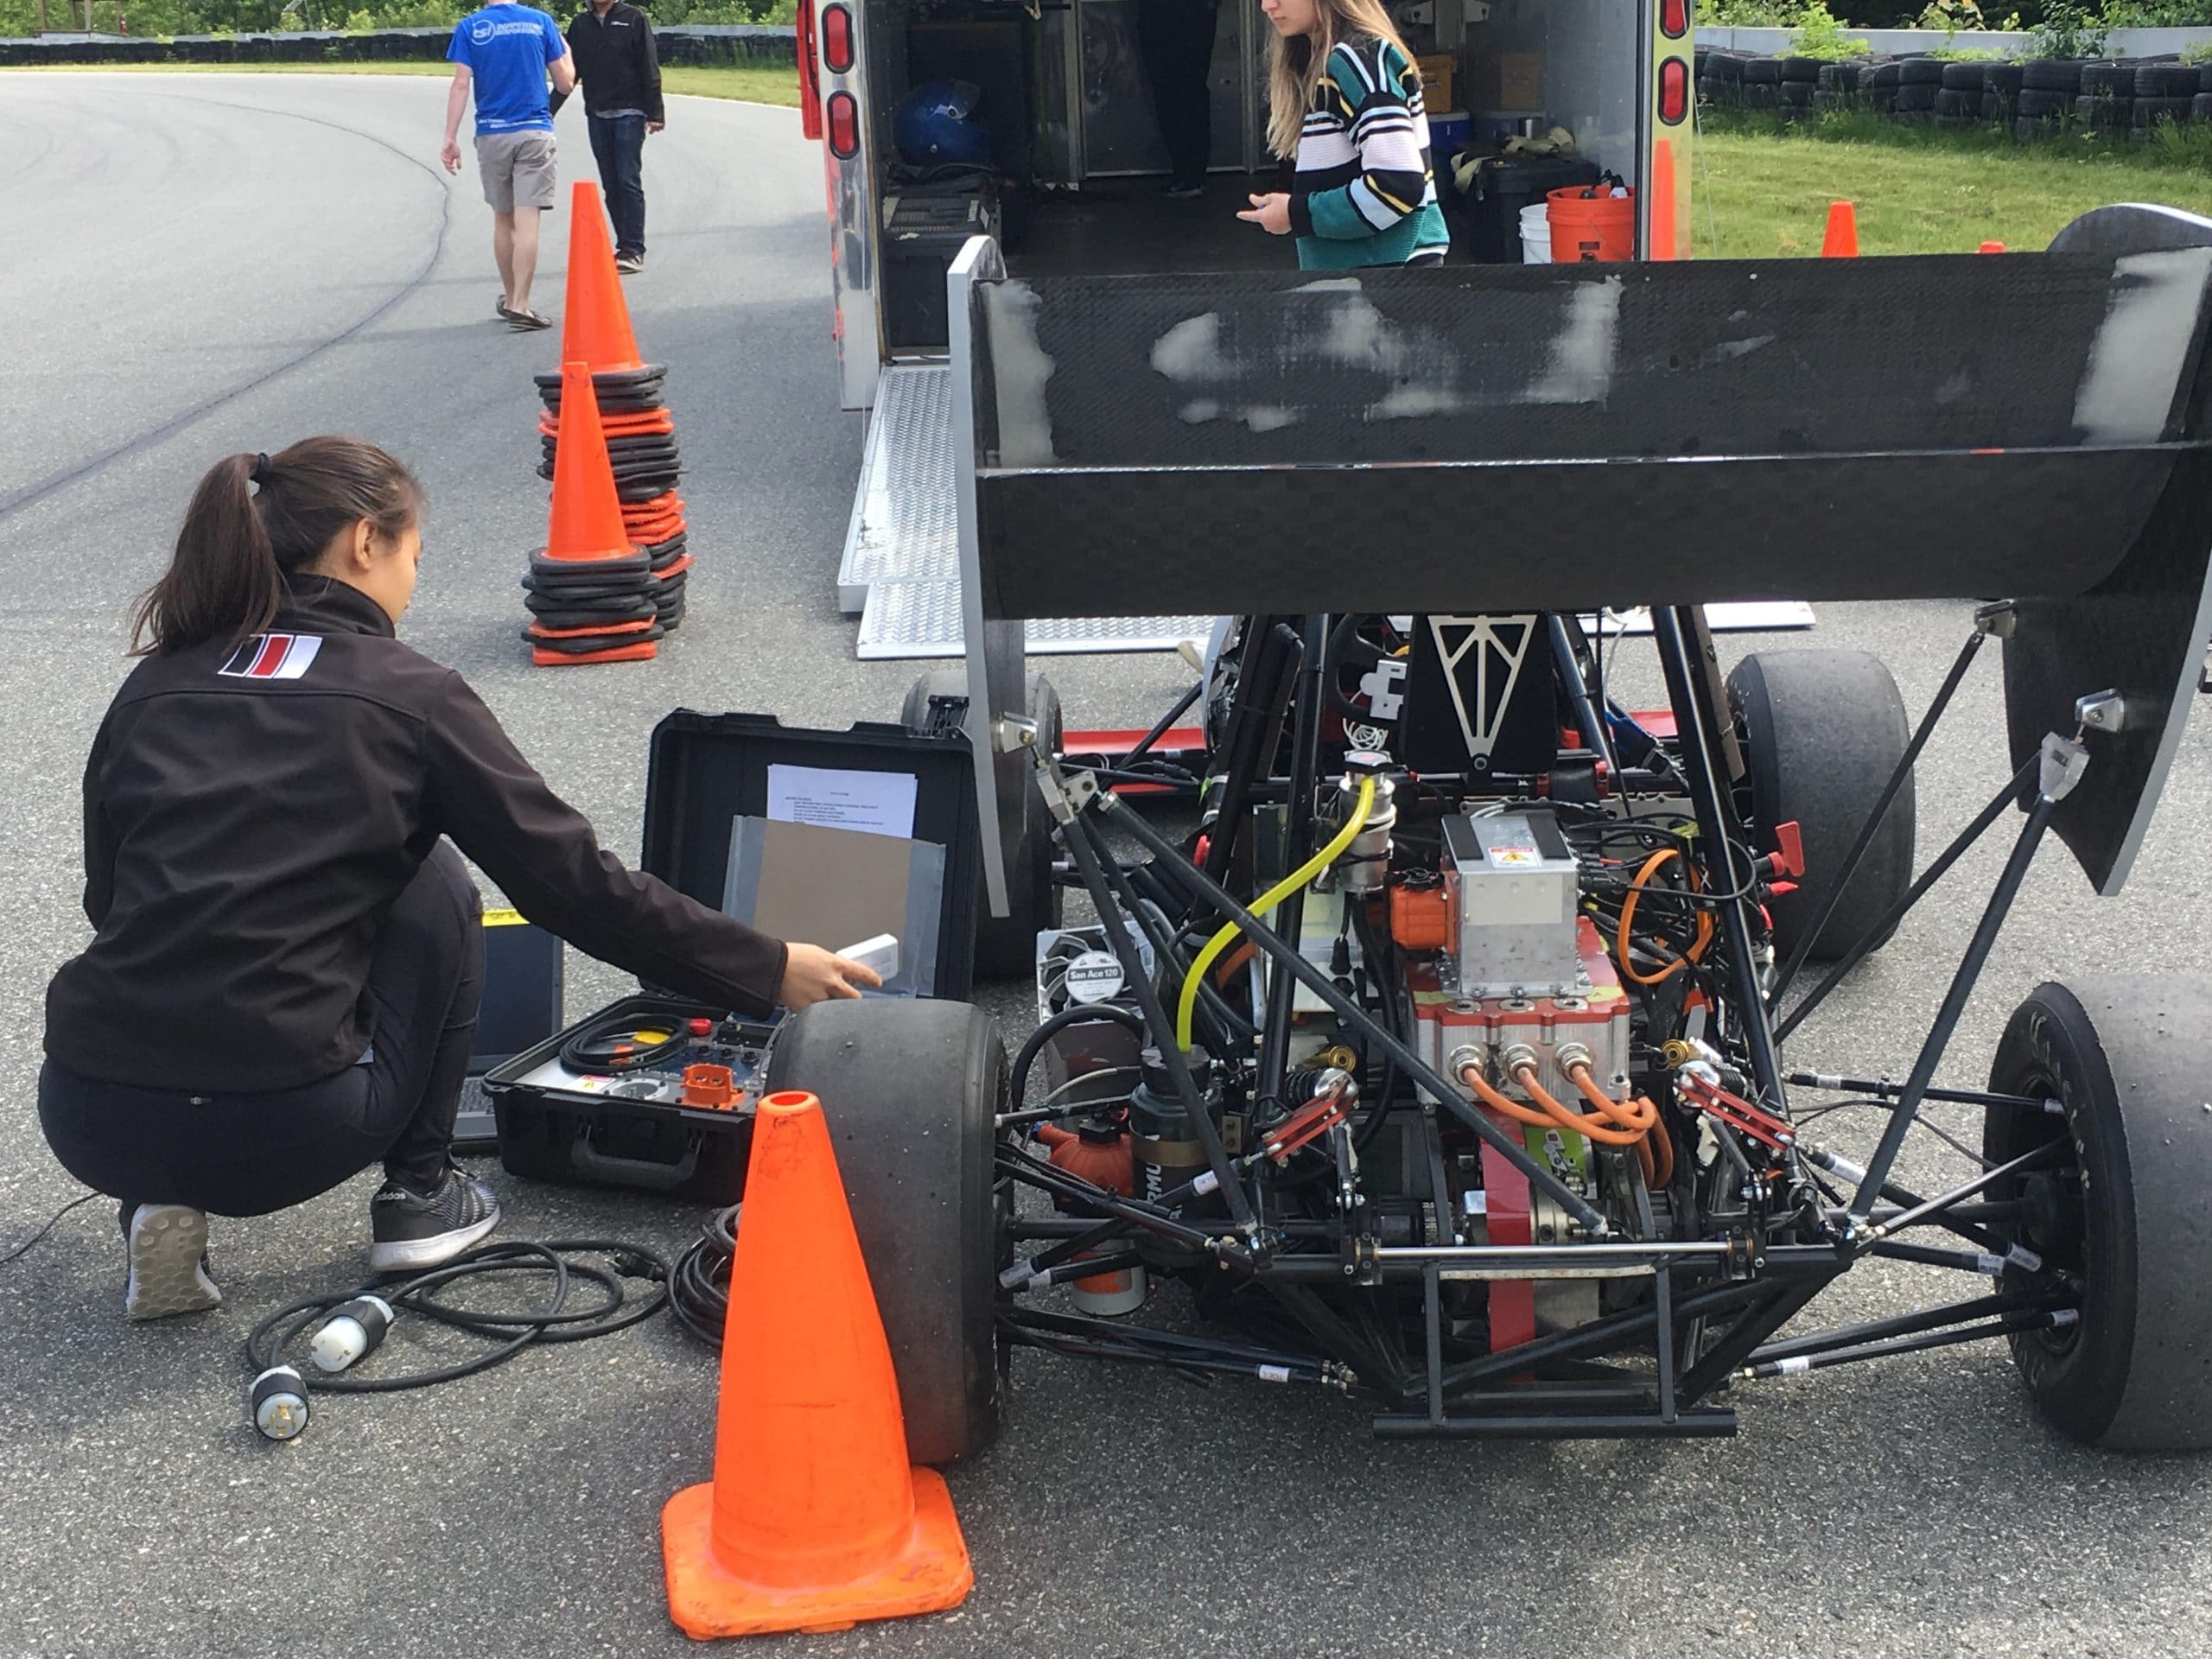
Our university motorsports team is one of the top teams competing annually in the Formula SAE Electric competition in Lincoln, NE. Members spend the fall semester reviewing state-of-the-art systems and previous team iterations for each subsystem before designing the current year’s vehicle. Building the car is only half of the process. Upon completion of various systems, we validate the design through component and vehicle testing. Custom electronics are used to relay data to the team that help tune the vehicle and improve the driver’s ability.
Our latest race car weighs in at 230 kg, and has a 100 kW Emrax motor that outputs 240 Nm of torque to allow the driver to reach 70 mph quicker than you can read this sentence. To reach maximum performance, the suspension uses 4-way adjustable coilovers to allow the car to sit an inch off the ground, and slick racing tires allow the driver to experience up to 1.5 G’s of lateral acceleration mid-turn.
Improving Design Using Data
In past years, motorsports’ race cars either did not feature a data acquisition package, or were severely limited in data rate. With MY18, our latest vehicle, one of the primary goals was building a custom data pipeline capable of handling the amount of data produced by our car. Such data are crucial for both informing the design of our parts as well as validating our simulations.
Using an in-house embedded device dubbed the “logger,” we are able to measure and record vehicle metrics ranging from power draw to lateral acceleration. Through our collaboration with Kx, we managed to expand our sensor suite to allow for more thorough data that will improve our testing and tuning process. This effectively raises the team’s ability to maximize vehicle performance using a data-driven approach. Equations and simulations are the first step to successful design, but running actual experiments on the real vehicle.
Data Acquisition Architecture
Physical Overview
The car is composed of several boards, most of which have microcontroller units on them. They interconnect using the CAN protocol running at data rates of 1 Mbaud on CAN0 and 500 kbaud on CAN1.
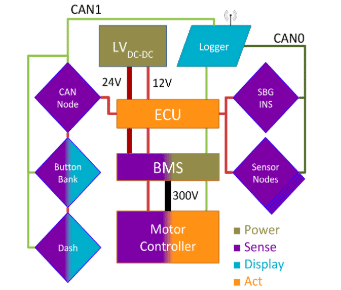
Overview of MY18’s low voltage system
The majority of the boards are there to collect and relay vital information about the car’s state in real time. Some of those data points are used by the Electronic Control Unit and are factored in to the controls’ algorithms while the rest are used by the team’s engineers to monitor vehicle performance or debug issues. For the latter to be possible, the Logger ensures that every CAN message from either CAN bus is logged on the on-board SD card. The Logger also features an XBee module capable of transmitting data over the 802.11.15 protocol at a rate of 115 kbaud. Due to the bandwidth limit of the radio module, there exists a filter that relays only certain CAN messages to a receiver ground station.
Data Format
CAN messages consist of an identifier and a data field that spans from 1 to 8 bytes. Several protocols exist for documenting the process of packing and unpacking useful information in those 8 to 64 bits. Our motorsports team has developed ParseCAN, a YAML-based CAN specification format followed by an accompanying Python parser.
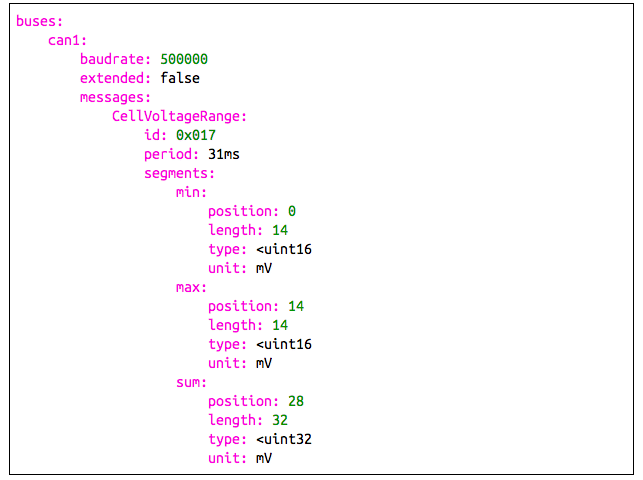
Excerpt of the ParseCAN specification that describes MY18
Parsing Log Files
ParseCAN’s Python framework allows for parsing logs of raw CAN messages into vectors, each set of which is accompanied by its own time series. Since the specification itself forms a tree, so does a parsed log file. For every CAN bus it contains one dictionary that maps to NumPy structured arrays containing the actual data.
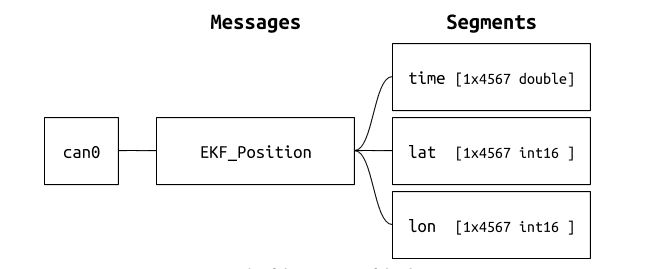
Example of the tree view of the data
This data structure is produced by a sequence of CAN messages that are parsed individually. A parsed message looks like the following.
{‘can0’: {‘EKF_Position’: {‘time’: 113.1, ‘lat’: 423622, ‘lon’: -710975}}}
Historic vs. Streaming Data
Since the entire data processing pipeline described here is atomic on the message level, there is no fundamental difference between a log file and a stream of raw CAN messages other than the latter being real-time. This allows us to use the exact same tools that process historical data to process streaming data.
Development Process in kdb+
Knowing this last fact about the similarities of historical and streaming data tools, we decided to develop the real time processor in kdb+ using log files simulating a stream at first. Once the code written in q was functional we piped a live stream into the process. Kdb+ facilitated the process of simulating a stream from .csv files with only a few lines of code.
Ticker Plant Design
A ticker plant architecture was chosen for handling the incoming stream and forwarding it to subscribers. In this case subscribers could range from a Kx Dashboards instance to multiple kdb+ instances that run real time calculations on a subset of the incoming data. Another reason for which the ticker plant was chosen was the existence of documentation on building feed handlers, pieces of code not necessarily in q that are responsible for formatting and feeding the data into the ticker plant. The freedom the ticker plant model provides as far as data entry is concerned was vital to supporting the aforementioned iterative development process.
Data Format
In an attempt to convert the aforementioned nested dictionary NumPy format in kdb+ we decided upon flattening the first level of hierarchy (can0, can1) and storing all data points for each message in a table.
For simplicity during the development phase we defined all fields other than time as floating point numbers. Proper type definitions were relegated to the feed handler.
Logging Scheme
The ticker plant init function takes the path to a log directory. It then sets d starting from 0 if no logs exist or counts up from the numerically largest name of a log file. Traditionally logs are named on an hourly or daily basis, but in our case the intent was to have a log per lap. Thus d here represents the number of the lap.
init: {[logpath]
    w::t!(count t::tables`.)#();
    d::max "I" $ string key logpath;
    if [d=-0Wi; d::0];
    new[logpath;1];
}
The new function takes the log path and if b is truthy it will increment the lap counter. Then it will attempt to open a new log file with filename d within the log path.
new: {[logpath;b]
    if[not b; hclose l; d::d+1];
    L:: `$raze string logpath,d;
    $[not (`$string d) in key logpath;[L set ();i::0];i::-11!(-2;L)];
    l:: hopen L;

    {(neg first first x)"reinit[]"} each (distinct value .u.w);
    d
}
The upd function is rather simplistic. f gets the columns of the table named t in the . namespace. g is a table with the same schema as t but containing only the new data found in x. g then gets published to all the subscribers and pushed to the log file.
upd: {[t;x]
    .lb.t: t;
    .lb.x: x;
    if [not count x; :()];
    f: cols getfromdot[t];
    g: $[0>type first x; enlist f!flip x; flip f!flip x];
    pub[t; g];
    if [l; l enlist (`upd; t; g); i+:1];
}
Generic Subscriber
This subscriber connects to the ticker plant, applies the schema of each table to the current namespace by calling .u.sub, and replays the log. The update function simply upserts new entries into the tables defined upon subscribing.
\l tick/r.q
h: hopen 5010

upd: {[tabname;tabdata] tabname upsert tabdata}

.u.rep .(h:hopen `$":",.u.x 0)"(.u.sub[`;`];`.u `i`L)";
Fake Feed
To be able to test both the ticker plant, the analytics, and the dashboard features during development it was necessary to develop a feed handler that plays back historic data, which we have in .csv format.
getcsvs: {[dir]csvs:key dir;(`$-4_'string csvs) set' {((count csv vs first
read0 x)#"f";enlist csv) 0: x} each`$raze each string dir,/: csvs}

path: `:C:/Users/nicks/Desktop/logs/;
tabs: getcsvs[path];

// Fix csv first row that begins with #
{x set `time xcol .u.getfromdot[x]} each tabs

beginTime:2018.06.23D12:42:22;
{update time:beginTime + `long$1000000000*time from x} each tabs;

// Initialize the tickerplant
logpath: `:logs;
.u.init[logpath];

t: beginTime;
step: 100000000;
fakeupdate:{{.u.upd[x;flip value flip select from x where (time>=t) &
(time<t+step)]} each .u.t; t::t+step};

.z.ts: fakeupdate;
begin: {system "t ",string (step % 1000000)}
Feed Handler
The feed handler for the telemetry data was written in Python 3 using PyQ. Messages came through serial over XBee and were parsed using our in-house ParseCAN framework. After parsing, the incoming values were tagged with the appropriate table name symbol and passed to .u.upd. The bottleneck in the pipeline is the XBee transmission, which gave us the freedom to implement the feed handler in Python in only a few hours. With a faster reception medium it might become necessary to convert the feed handler to C.
Dashboards
Setting up polling queries in Dashboards was a fast process. The query editor was just like an editor for a .q file, making the implementation of analytics within a Dashboards data source very easy. This gave us a lot of time to ponder about and design the data projection layouts we deemed the most critical to view during each of the dynamic events at the FSAE competition.
One of the dashboards designed for the 22 km endurance race
One of the major advantages compared with traditional telemetry clients that receive and display incoming data within the context of a single application is the decoupling of the data reception and projection. With the kdb+ and Dashboards pipeline we are able to have a single computer receive telemetry from the race car, store it in memory, and then serve it to the Dashboards clients that may be local or remote. By setting up a WLAN network, multiple clients on different computers may look at any of the dashboards, thus preventing team members from needing to huddle around one computer screen.
Future applications of Dashboards include monitoring the lap times of other teams on track and recording those in the database. This can happen through mobile clients connected to the main Dashboards instance and buttons that execute queries that update our log of other teams’ times. Then, during our own race, we can have real time analytics that compare our lap times to other teams and allow the crew to inform our driver when to push or when to conserve energy.
Conclusion
Although many different types of databases fit our demands in terms of paradigm and speed, kdb+’s querying and analytics capabilities and its tight integration with Kx Dashboards allowed us to build a robust solution that was more than capable of scaling to the quantity of data produced by MY18’s telemetry system. Kx Dashboards is a unique product with almost no quality competition in the web-based streaming data visualization field. The drag-and-drop UI designer was highly intuitive and let us accomplish all of our plotting needs. In conclusion, the suite of kdb+, PyQ, and Kx Dashboards gave our motorsports team a competitive advantage by powering our telemetry and distributed data visualization pipeline boasting an unparalleled time to market.


