By Kieran Hennessy and Declan Fallon
The emergence of Covid-19 has highlighted how access to open data is critical in developing an understanding of complex problems; in this article, we will show how KX Dashboards can bring these insights to life.
Until the pandemic, data visualization lived in a world where big data was a product generated through the globalization of business and consumption. It was where answers to your questions were for internal consumption or shared with a select few. But post Covid-19, data visualization now finds itself consuming global data of a different kind, where the need is for the information presented in a clear, concise and unified manner for public consumption. The John Hopkins University of Medicine dashboard was the first response, as it tracked the march of Covid-19 across the world [1].
What started as a small project, collecting data and processing it manually from a number of countries, principally China, has since evolved into a more robust, automated data monitoring service [2], based on data which is free to use [3]. Individual states and counties have merged the data with locally available information such as demographics, numbers of tests conducted and positive infection rates [4]. Other dashboards have looked at the evolution of Covid-19 mutations as the virus migrated across the globe [5]. While social distancing has become one of the primary means to control the spread, crowdsourcing has been used to collate tools, data and tech relating to Covid-19 [6] to monitor it.
Using the CSSE data, we applied KX technology to extrapolate from the data, daily changes in active cases, new cases and recovered individuals both globally and by country. From there, we visualized the outputs, but also integrated the data with updated news and commentary as it pertained to individual countries [7], alongside WHO updates [8], to provide a holistic view to developing events.
We start with a kdb+ import script of the publicly available CSSE data made available at end-of-day. The kdb+ script sanitizes the data, before calculating the number of new, active, recovered and terminal Covid-19 cases for each day, in addition to maintaining cumulative totals of infections over time.
KX Dashboards are then used to present the data across two tabbed screens.
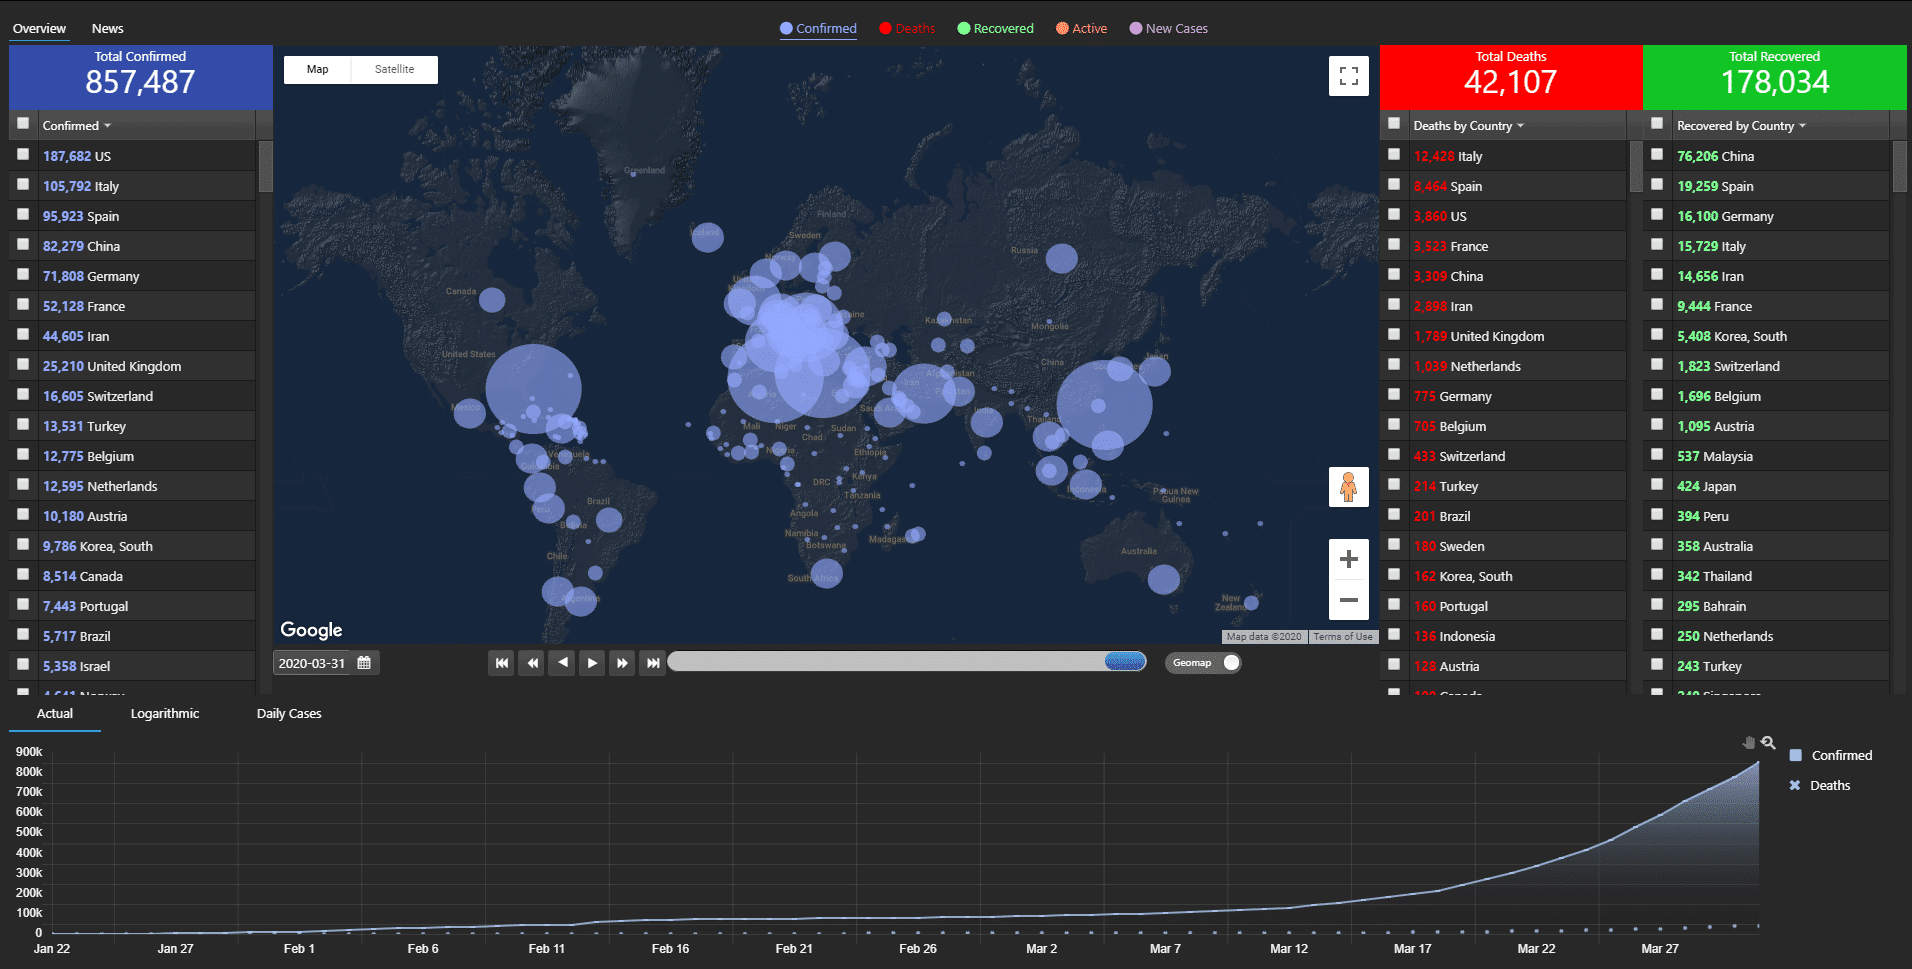
The first screen is an Overview of Covid-19 infections; an Editable List component is used to manage the country selection. The benefit of using this component is that it allows multiple countries to be selected and compared; for example, the lower chart in the screenshot below compares the development of confirmed cases for the U.S., China and Italy over time; an option to switch the axis type to logarithmic as Covid-19 cases increase is also available. A map tooltip provides additional information around active cases and mortality.

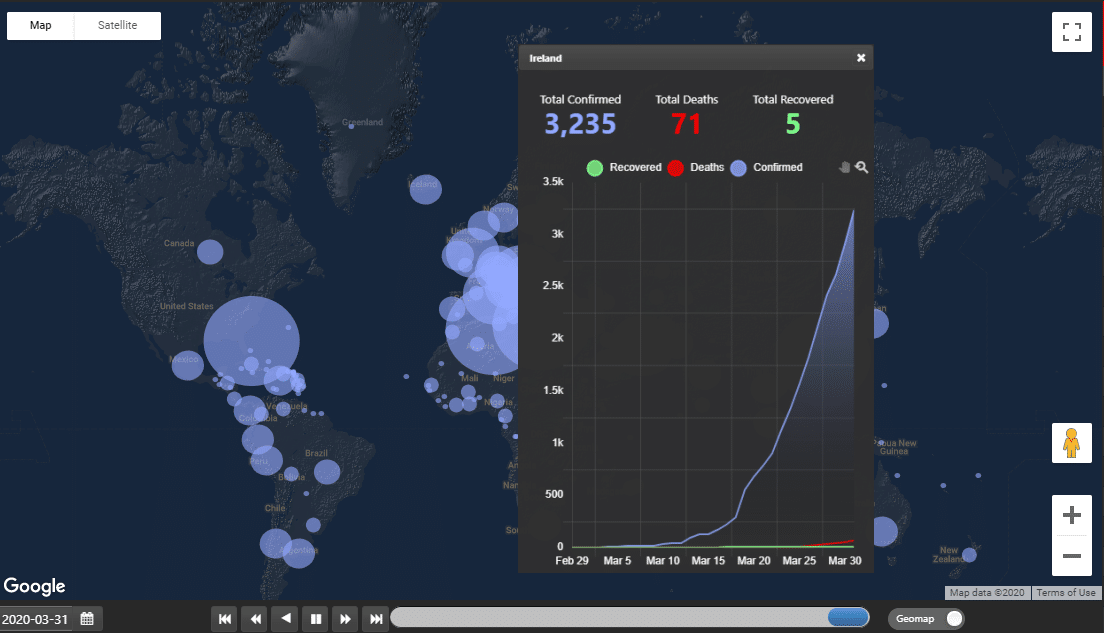
An additional pop-up is available on an individual bubble selection from the map showing mortality, recovered and confirmed cases for the selected country. Users also can switch between views for confirmed, deaths, recovered active and new cases from the map.
Dashboard users can also playback the data to see how Covid-19 infections evolved over time.
To find out more about dashboards, click here.
References:
[1] coronavirus.jhu.edu/map
[2] https://systems.jhu.edu/research/public-health/ncov/
[3] https://github.com/CSSEGISandData/COVID-19/tree/master/csse_covid_19_data
[4] https://dashboard.cityofboston.gov/t/Guest_Access_Enabled/views/COVID-19/Dashboard1?:showAppBanner=false&:display_count=n&:showVizHome=n&:origin=viz_share_link&:isGuestRedirectFromVizportal=y&:embed=y
[5] https://nextstrain.org/ncov
[6] https://coronavirustechhandbook.com/
[7] https://news.google.com/rss/
[8] https://rss.app/feeds/byrXRIMzf3GV68Cq.xml


